Nanometrix takes raw single-molecule localisation data from any SMLM instrument, realigns and groups it, runs analysis at scale, and turns the result into shareable reports and predictive models.
Export localisations from your acquisition software, drop the CSVs into Nanometrix, and start working. No vendor lock-in, no bespoke import scripts — if your instrument can produce a localisation table, the platform can read it.
Group samples by condition, nest populations into projects, and keep the same taxonomy from raw upload through to the final report. Unlimited projects and groups across every tier.
Localisations as acquired.
Channels brought into register.
Vesicles segmented & identified.
Sample-by-sample comparison.
SMLM channels are usually acquired sequentially or split across the camera, so they drift apart at the nanometre scale. Our realignment algorithm registers channels back onto a common frame in one click — turning misaligned acquisitions into publishable data without manual fiducial work.
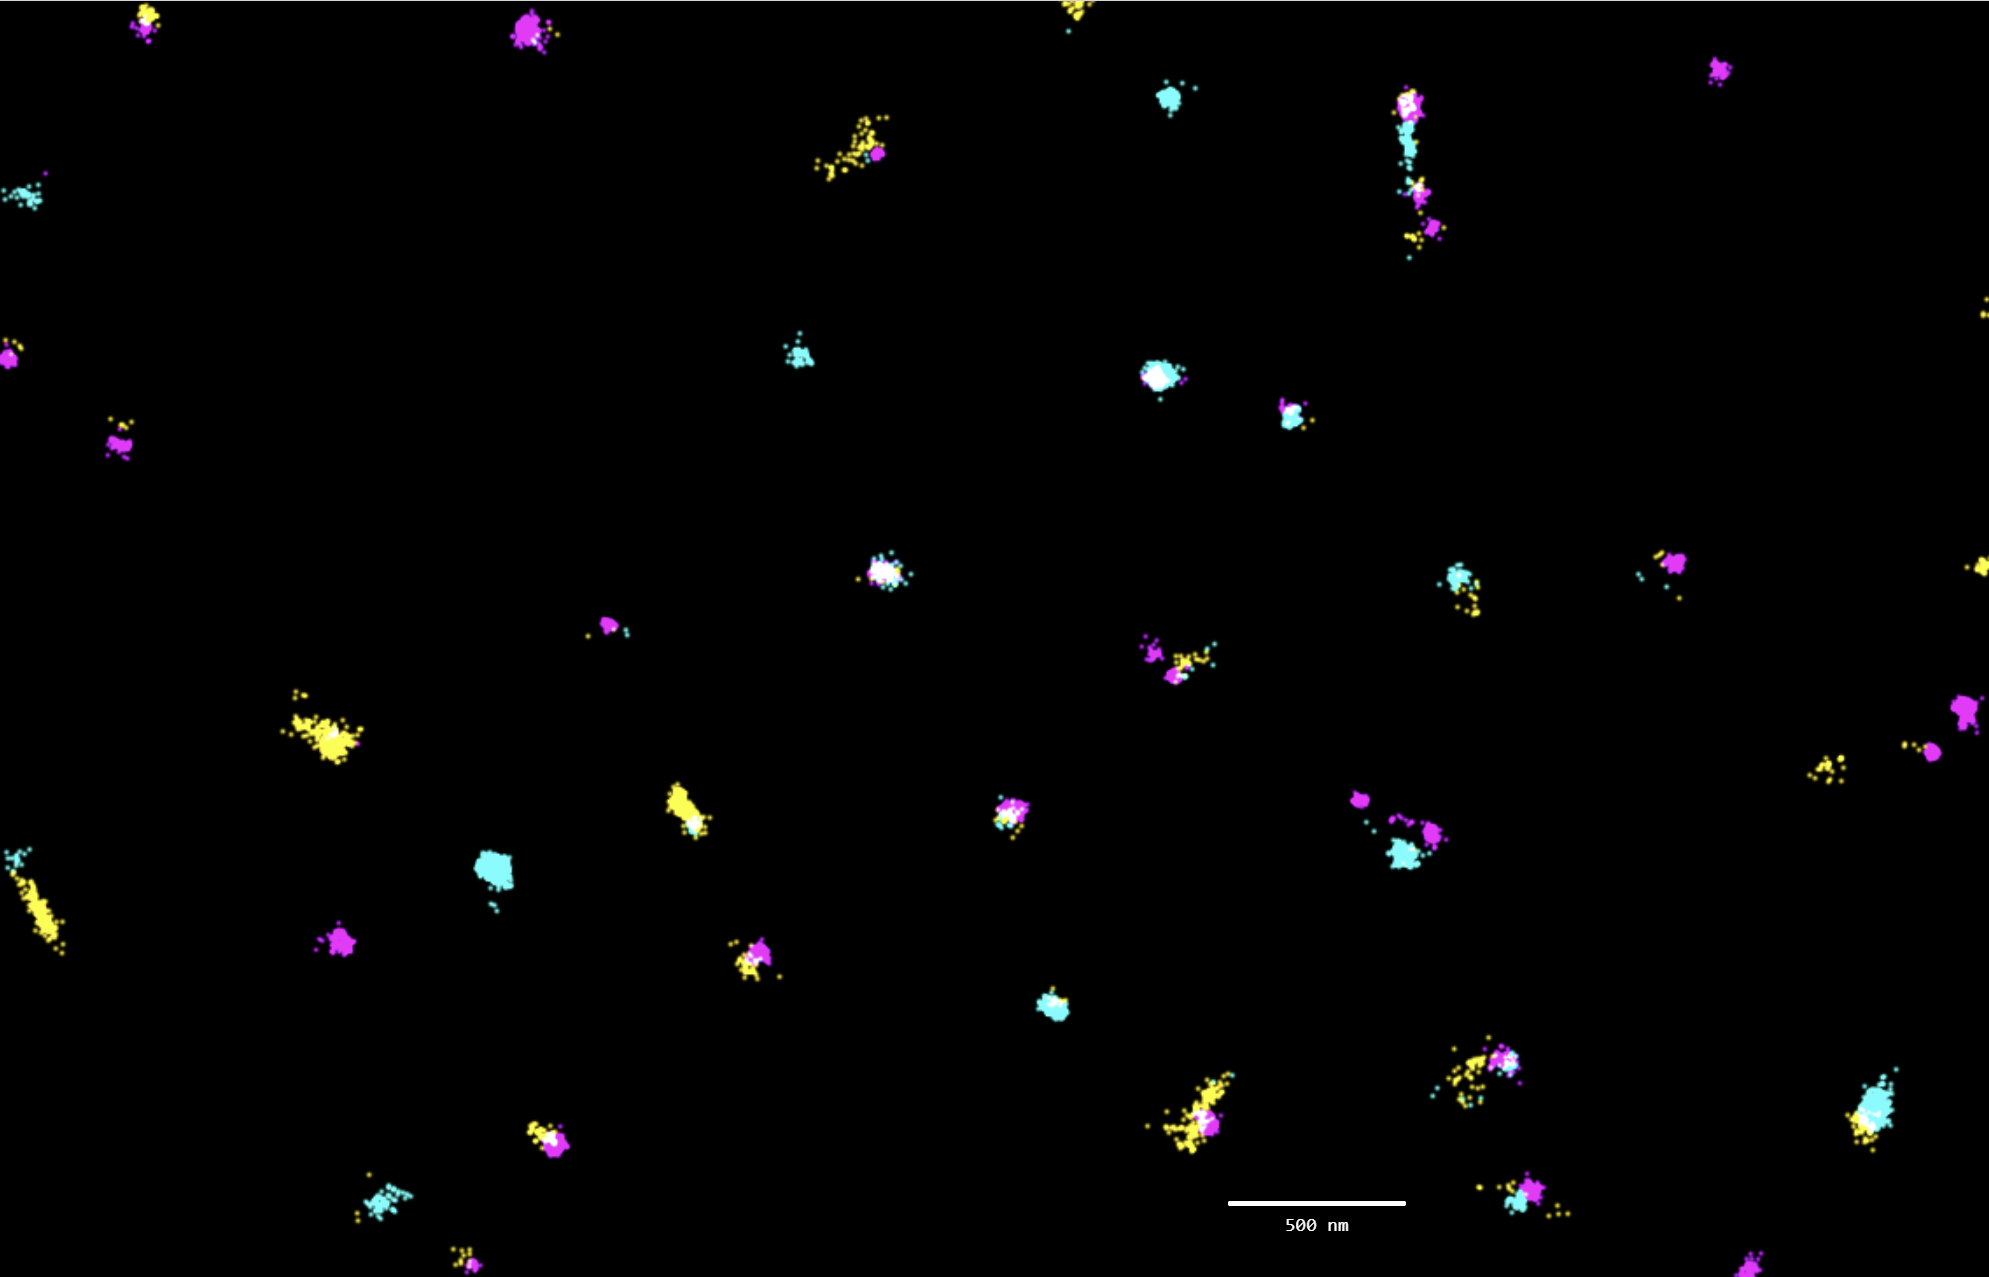
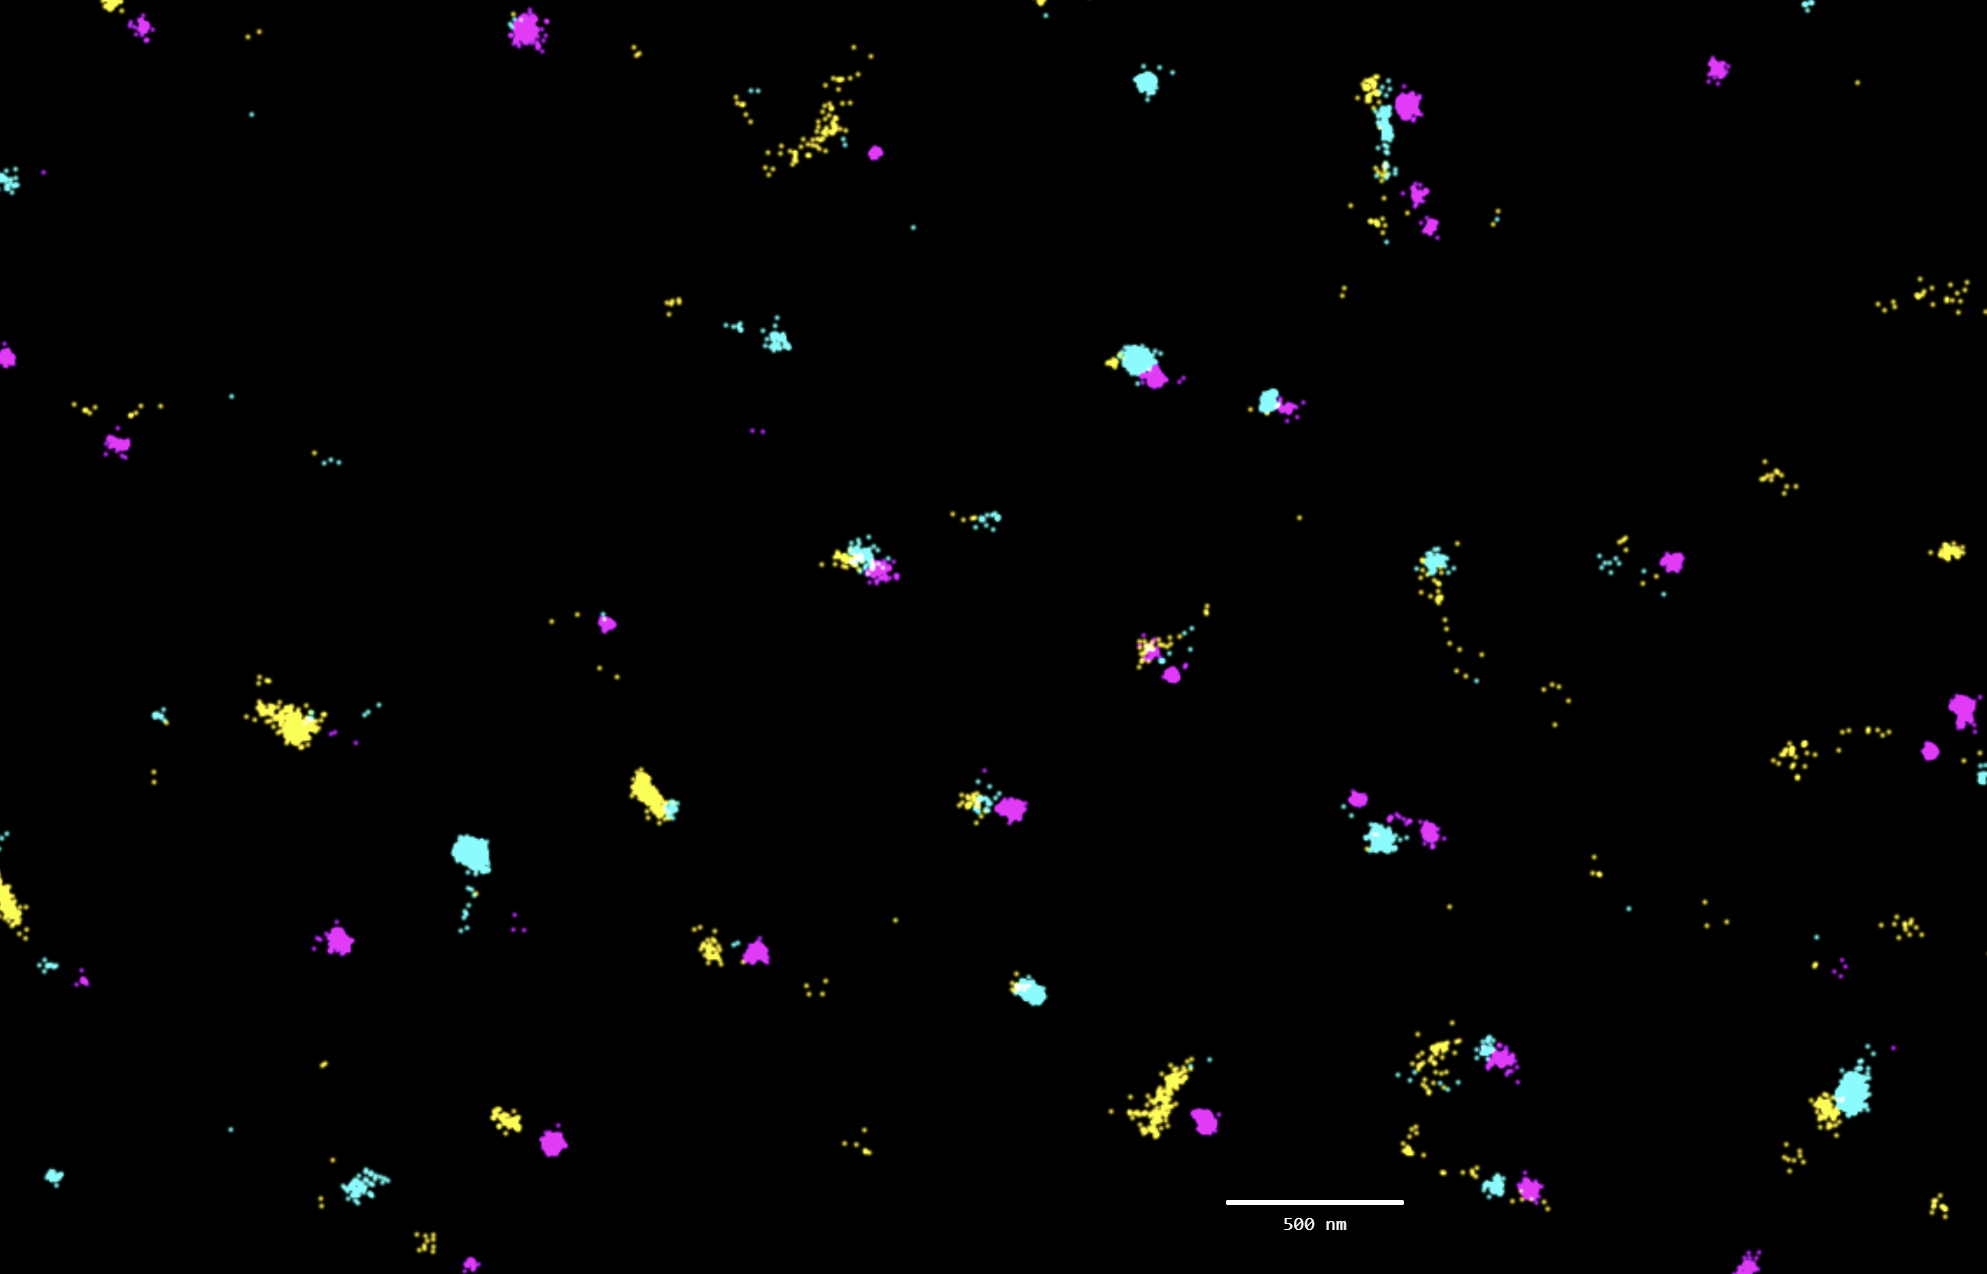 Misaligned
Realigned
Misaligned
Realigned
Switch perspectives without exporting, re-importing, or reformatting. Inspect points at their native localisation density, then pull back to vesicle-level summaries or sample-level grids.
The same data, reframed for the question you're asking right now.
Sequential analysis works for a handful of samples. Real cohorts don't. Nanometrix runs analyses in parallel across managed compute, so a 100-dataset library finishes in roughly the time a single dataset used to take.
The pipeline is fully customisable: data realignment, DBSCAN-based vesicle identification, and a complete EV metric panel computed for every vesicle found — tune the steps you need, skip the ones you don't.
Each dataset ≈ 5M localisations · shorter is better
Online execution dispatches work across managed parallel compute — wall-clock stays roughly flat (≈30s) while the offline and Python pipelines scale with cohort size.
Each vesicle is summarised across size, morphology, channel colocalisation, and inter-channel geometry. The same panel runs on every dataset, so cohort-level comparisons are apples-to-apples.
Diameter and equivalent radius across channels.
Per-EV channel overlap and co-presence.
Hollowness, convex ratio, perimeter, area.
Percentage overlap and distance between channels.
Once a cohort has been analysed, the insight layer takes over. Compare populations side-by-side, run statistical tests across every metric, and export the figures that go straight into a paper or a regulatory dossier.
Pick a selection — a single dataset, a population, or an entire project — and Nanometrix lays out the headline metrics in one dashboard. Mean size, co-localisation rates, single / dual / triple-channel populations, all on the same canvas.
Healthy vs disease. Lane 1 vs lane 2 of an EV chip. Patient 01 vs patient 02. Pick any two — or any N — populations and Nanometrix overlays their metrics on a single graph. Switch chart types, filter on the fly, and let the stats engine tell you whether what you're seeing is real.
A4 layout with cohort-level summary, filtered metric panels, and statistical callouts. Replace with the rendered PDF when ready.
Tell us where to send it and what you'd like to explore.
Once your library is analysed and grouped into populations, the Diagnostics AI Pipeline trains a tailored predictive model that classifies new samples from their EV profile alone. We work with you on study design, model architecture, and validation — so the result is something you can actually deploy.
Ideal for labs, core facilities, and enterprise customers that need a shared analysis surface with proper guardrails. A PI can review individual reports per student, set quotas on pooled storage, and allocate short-term licences to rotating users.
Data is encrypted in transit and at rest, stored on access-controlled infrastructure, and every read and write passes through explicit user authorisation. SSO, RBAC, audit trails, and SOC 2 / HIPAA / GDPR coverage on Team & Lab.
Free for individual researchers. Move up when your cohorts, compute, or compliance needs grow.
